Make It. See It. Love It.

A development board with a built-in debug lab. 16-channel logic analyser, CMSIS-DAP debug probe, and a 25-LED pin dashboard — all on one board, through one USB cable.

See the Superboard Get in Touch

See It in Action

The Superboard in 60 seconds — logic analyser, debug probe, and the LED dashboard, all over one USB cable.

The Problem with Embedded Development

Every embedded developer has asked the same questions: "Is this pin doing anything?", "Did the chip actually program?", "Why does this work on one board but not another?" — Traditional boards leave you guessing. The Superboard gives you answers.

🔍

16-Channel Logic Analyser

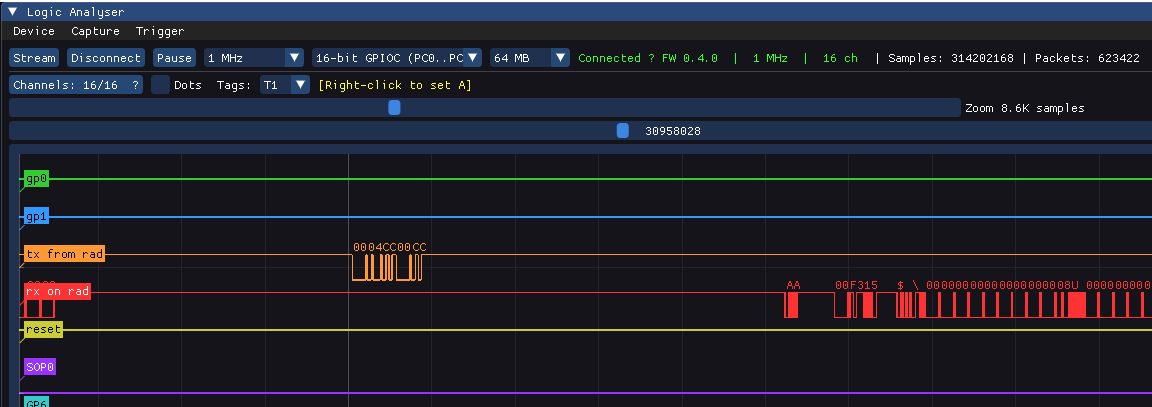
Sixteen target GPIOs run straight into the on-board capture engine. See SPI, I²C, UART, and bare GPIO transactions in real time — no external analyser needed.

🐛

Integrated Debug Probe

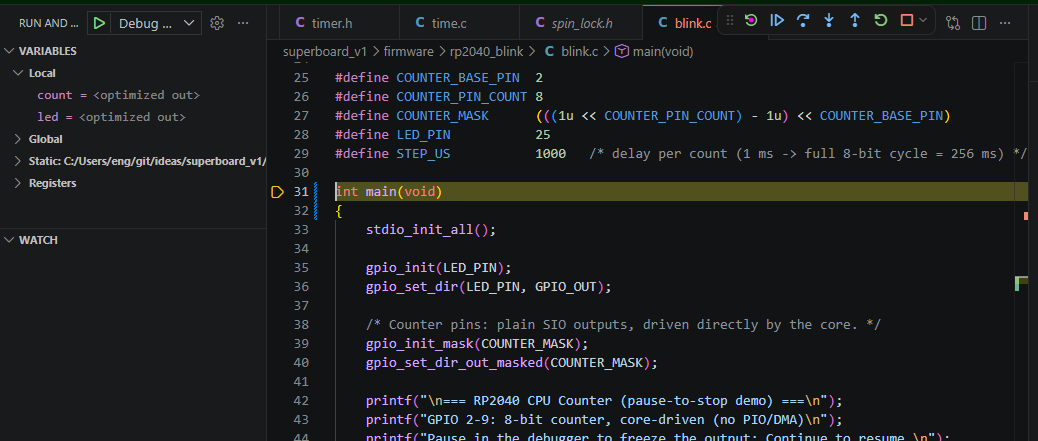
CMSIS-DAP over USB — works with OpenOCD, pyOCD, VS Code, and every major SWD-aware IDE. No separate probe to plug in.

💡

25-LED Pin Dashboard

A 25-LED dashboard; 24 of the 25 mirror the RP2040 GPIO pins in real time. See your pins toggle without reaching for a scope.

🔌

One Cable, Everything

The on-board co-processor presents a composite USB device — virtual COM port, logic analyser stream, and debug probe — all over a single USB-C cable.

📌

Full GPIO Breakout

Every user-accessible target GPIO is exposed on headers. Wire out to a breadboard, probe with a scope, or just poke things with a multimeter.

📂

Native UF2 Bootloader

The RP2040's stock USB bootloader is preserved — drop a .uf2 onto the drive and the board flashes itself. micro:bit-style first-time experience.

It All Comes Built In

The logic analyser, the debug probe, and the 25-LED pin dashboard aren't add-ons — they're on the board. No separate probe, no external analyser, no extra kit to buy.

One Board, the Whole Bench

A 16-channel logic analyser, a CMSIS-DAP debug probe, a 25-LED pin-mimic dashboard, and a full GPIO breakout — all on a single PCB, all reached over one USB-C cable.

The instruments you'd otherwise buy separately, a logic analyser and a debug probe, are built in, watching your target the moment you plug in.
One Board, the Whole Bench

A Real Logic Analyser, Included

Tap the target's GPIOs and watch SPI, I²C, and UART traffic decode live in the Workbench viewer — or capture to CSV from the command line with la_cli.

This is the on-board analyser streaming over USB. No external analyser, no extra hardware — it's already in the board you're holding.

A Real Logic Analyser, Included

How It Works

The board carries a dedicated on-board co-processor that watches the target MCU without interfering. One USB cable does everything.

1. Plug In

Connect a single USB-C cable. The co-processor enumerates as a composite USB device — debug probe, logic analyser, and serial console — using inbox drivers on Windows. No installer, no Zadig.

🔌

2. Write Code

Use your favourite IDE — VS Code, Arduino, the Pico SDK, whatever you already know. The co-processor speaks standard CMSIS-DAP, so every SWD-aware toolchain works out of the box.

💻

3. See Everything

Launch the Workbench viewer (Dear ImGui + ImPlot) for live waveforms, or use the la_cli capture tool from the command line. CSV out, pipe it anywhere.

📊

Where We Are

Superboard V1 — On the Bench

V1 is a working prototype, and a small batch has been built. Hardware is fully populated; the logic analyser, the GPIO LED dashboard, and the composite USB device — debug probe, LA stream, and serial console on one cable — are all up. Flashing the RP2040 over the probe works with standard OpenOCD/pyOCD, and a one-click Windows installer with an automated self-test is ready.

Active work: a more legible LA timeline, USB field-update (no J-Link needed), and a V2 PCB that fixes V1 errata (SWD header pinout) and tightens the layout. Drop us a line if you'd like to follow along.

Superboard Details →
🔧

Want to See the Board?

V1 is a small-batch prototype. Get in touch for evaluation units or to follow the project.

See the Superboard Get in Touch